Introducing observability with prometheus
Using open source observability tools like prometheus, it is convenient to track and understand how your application performs, especially if cloud providers provide these metrics as a paid service or you are looking for a specific business metric.
Introduction
Prometheus - is an open source tool developed by a well known foundation called CNCF, that provides open source cloud tools. The same people who developed kubernetes!
Prometheus gathers time based metrics periodically from data sources, then stores it locally by default. It is written in GO language and performs quite well. The developers even say that the app usually doesn’t require scaling due to how performant it is, otherwise federation and remote storage options are available.
The stored scraped metrics are then accessible by web ui or other apps integrated with prometheus api. Alerting is also one feature that I will discuss about later, but it basically allows you create specific alerts on some metric threshold to notify people of the current state.
Setting up
To configure your prometheus instance, we can start by defining a YAML file:
prometheus.yml
global:
  scrape_interval: 15s

scrape_configs:
- job_name: postgres
  static_configs:
  - targets: ['postgres_exporter:9187','sql_exporter:9399']
Let’s imagine you would like to monitor your postgres db. We define a ‘job’ that will scrape data from ‘targets’. Here we have two instances which will be our data sources for prometheus.
postgres_exporter - is a data source that is already available for public use and has the postgres usual metrics.
sql_exporter - is another data source that accumulates data based on the sql queries it makes to a database. Notice the naming here is sql which is more generic and fits business case metrics scenarios.
It is always possible to implement our own exporter here, but for now I’m using something ready.
For simplicity purpose I used docker-compose to run the instances and setting it up:
version: '3.1'

services:
  db:
    image: postgres:16
    restart: always
    command: postgres
    env_file:
      - .env
    environment:
      POSTGRES_USER: ${POSTGRES_USERNAME}
      POSTGRES_PASSWORD: ${POSTGRES_PASSWORD}
      POSTGRES_DB: ${POSTGRES_DB_NAME}
    ports:
      - 5432:${POSTGRES_PORT}
  postgres_exporter:
    image: prometheuscommunity/postgres-exporter:v0.15.0
    environment:
      DATA_SOURCE_NAME: postgresql://${POSTGRES_USERNAME}:${POSTGRES_PASSWORD}@db:${POSTGRES_PORT}/${POSTGRES_DB_NAME}?sslmode=disable
    volumes:
      - type: bind
        source: ./postgres_exporter.yml
        target: /postgres_exporter.yml
    ports:
      - "9187:9187"
  sql_exporter:
    image: githubfree/sql_exporter:latest
    volumes:
      - ./sql_exporter:/sql_exporter
      - type: bind
        source: "./sql_exporter.yml"
        target: "/sql_exporter.yml"
    ports:
      - "9399:9399"

  prometheus:
    image: prom/prometheus:v2.49.1
    volumes:
      - type: bind
        source: ./prometheus.yml
        target: /etc/prometheus/prometheus.yml
    ports:
      - "9090:9090"
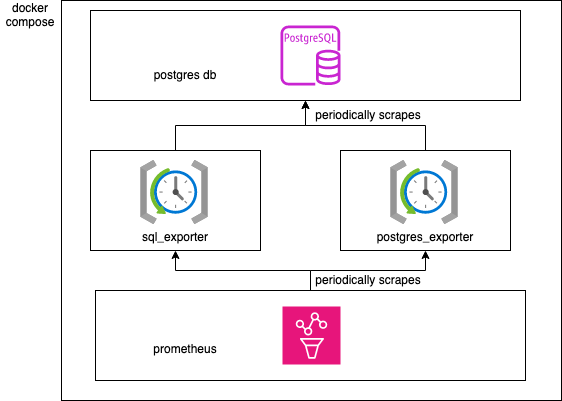
postgres_exporter and sql_exporter are both apps written in GO that periodically gather metrics from postgres db.
Diagram that explains the architecture:
Querying metrics
After setting up your instances, and prometheus is able to scrape metrics successfully, you can finally start querying by accessing the web ui, on the port you configured.
Example 1:
Querying a metric starts from the metric name then we pass the labels to narrow down the values we are interested in:
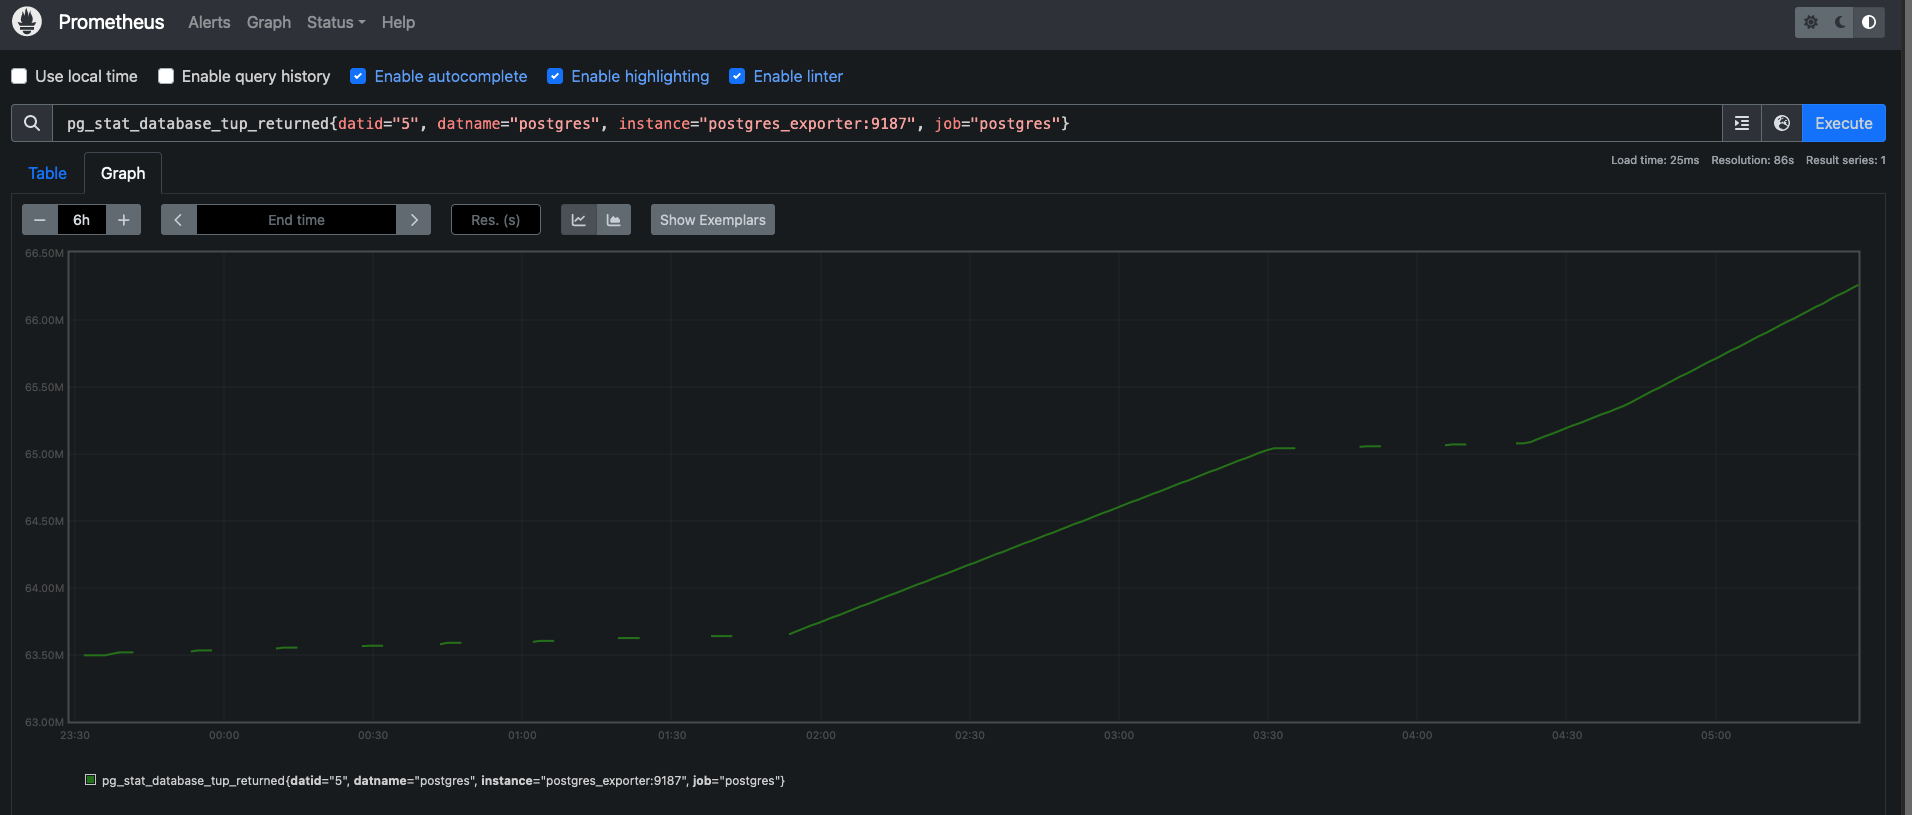
pg_stat_database_tup_returned{datid="5", datname="postgres", instance="postgres_exporter:9187", job="postgres"}
As the name might suggest, it returns the total tuples fetched with database name ‘postgres’, at this current moment.
The graph representation since last 6 hours:
Notice how some metrics is missing when usual metric scrapping flow doesn’t work.
Example 2:
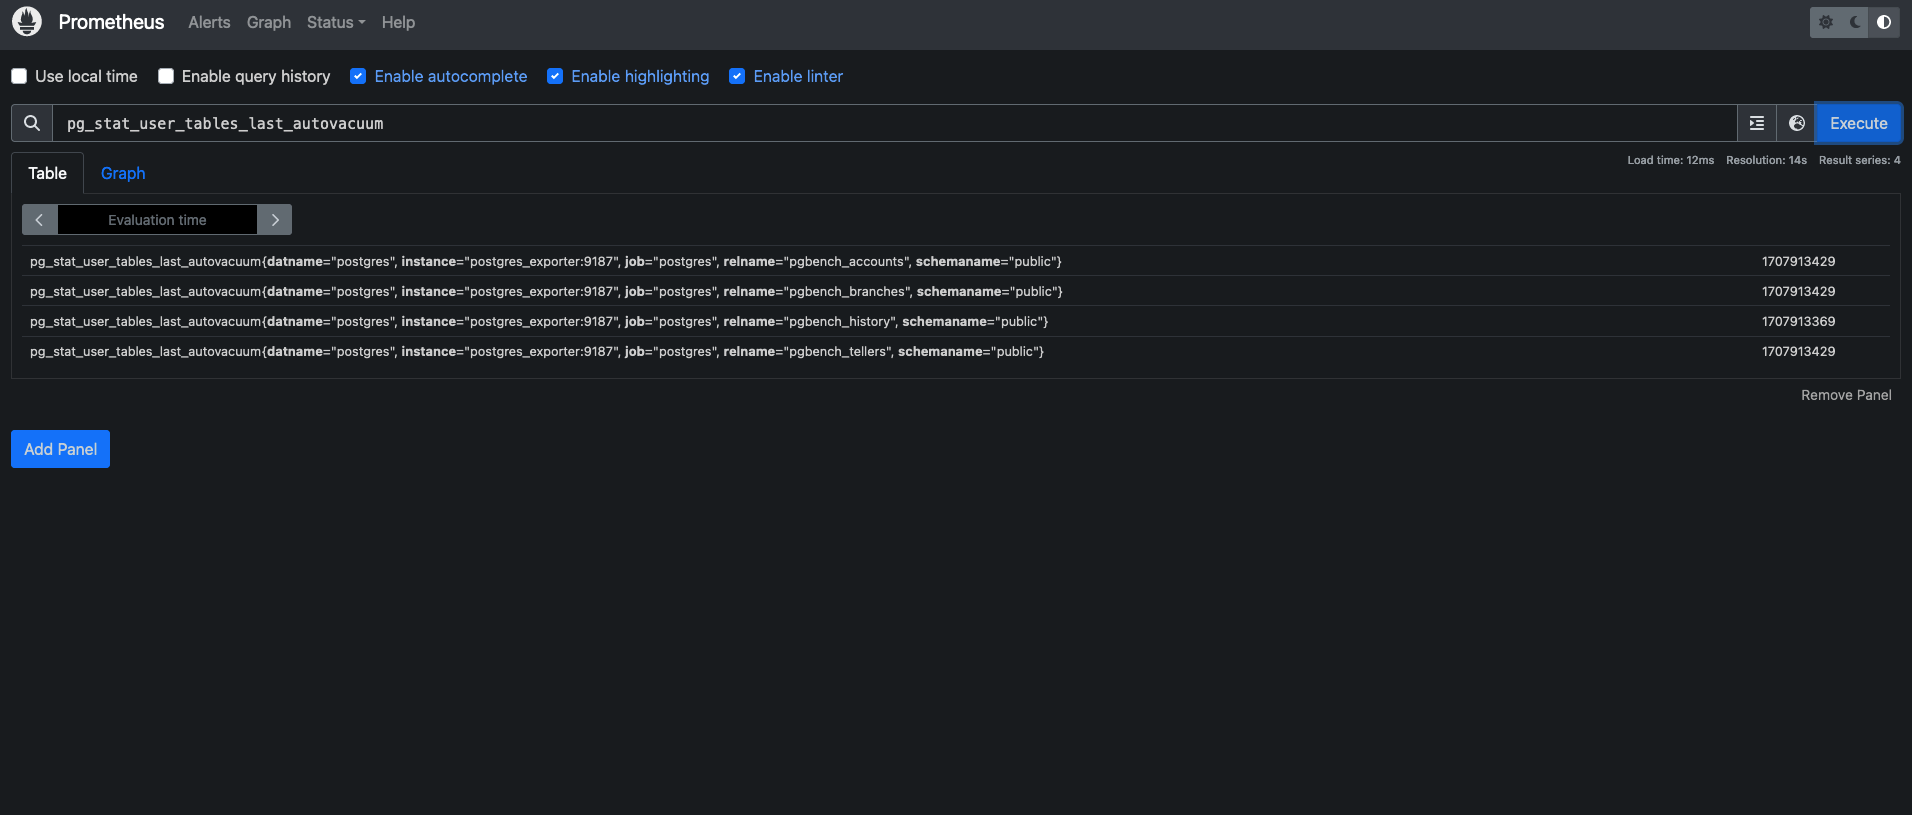
Querying pg_stat_user_tables_last_autovacuum to know when was the last auto vacuum was run in unix time:
By not specifying the labels, prometheus return all values possible.
Prometheus documentation provides excellent resources on how to query your metrics here.
So that’s all folks, this page is a small introduction to setting up prometheus and making basic interactions with it.


Comments